§ 1 The Idea
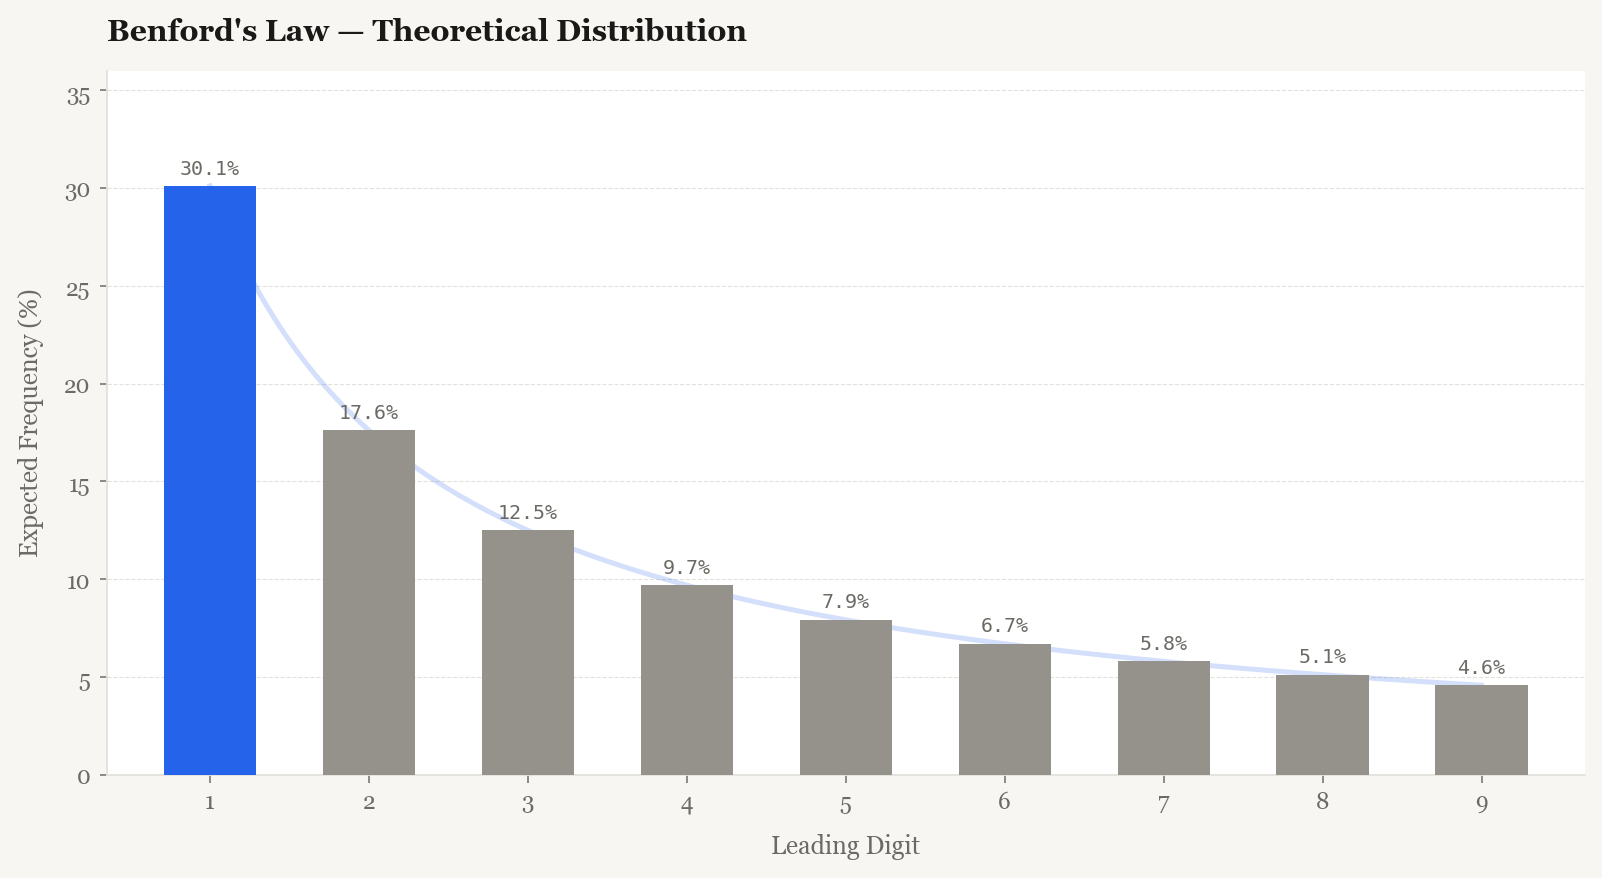
Benford's Law is one of those mathematical curiosities that feels like it shouldn't work, and then keeps working. The law states that in many naturally occurring datasets, the leading digit is not uniformly distributed. Instead, lower digits appear far more frequently than higher ones. The number 1 appears as the leading digit roughly 30% of the time. The number 9 appears less than 5% of the time.
It shows up in census data, stock prices, accounting figures, earthquake magnitudes, street addresses. The intuition is that data spanning multiple orders of magnitude — anything that grows or compounds over time — tends to spend more time with smaller leading digits simply because of how logarithmic scales work. Markets, which are multiplicative by nature, are a natural candidate.
What I found interesting is not that markets follow Benford's Law — they approximately do, most of the time — but what happens when they stop following it. When the observed distribution of leading digits in recent price changes diverges significantly from the Benford expectation, something in the data's behaviour has changed. The question is whether that change is tradeable.
§ 2 Why Price Returns Approximately Follow It
Daily percentage changes in asset prices are not uniformly distributed across leading digits. They can't be — the distribution of returns is itself structured. Small moves (0.1%, 1.x%, 2.x%) are far more common than large moves (8.x%, 9.x%). That asymmetry, when you extract just the first digit, produces a distribution that loosely mirrors Benford's.
The alignment is imperfect — financial returns have fat tails and are not scale-invariant in the strict sense — but over rolling windows of reasonable length, markets tend to produce digit distributions that pass a chi-square goodness-of-fit test against Benford's expected frequencies. The interesting signal is when they don't.
§ 3 The Implementation
The approach is straightforward. For each bar, I look back at the last n daily
percentage changes and extract the leading digit from each. I then run a chi-square test comparing
the observed digit frequency to the Benford-theoretical expected frequency. If the p-value falls
below 0.05, the window is flagged as a deviation.
pythondef leading_digit(x):
    if pd.isna(x) or x == 0:
        return 0
    return int(str(abs(x)).lstrip('0.')[0])

def benford(df, n=20):
    df['percentage_change'] = df['close'].pct_change() * 100
    df['leading_digit'] = df['percentage_change'].apply(leading_digit)
    benford_dist = np.log10(1 + 1 / np.arange(1, 10))
    df['deviation_flag'] = 0

    for i in range(n+1, len(df)):
        window = df.iloc[i-n:i]
        # Laplace smoothing (+1) to avoid zero-frequency issues
        frequency = window['leading_digit'].value_counts() \
                        .add(1, fill_value=1).sort_index()
        frequency /= frequency.sum()
        observed = frequency.reindex(range(1, 10), fill_value=0).values * n
        expected = benford_dist * observed.sum()
        chi2, p_value = chisquare(f_obs=observed, f_exp=expected)
        if p_value < 0.05:
            df.at[i, 'deviation_flag'] = 1

    return df
A few decisions embedded in that code are worth unpacking. The window is set to 20 bars — small enough to be responsive, large enough that the chi-square test has meaningful degrees of freedom to work with. Laplace smoothing (adding 1 to each count before normalising) prevents zero-frequency cells from inflating the test statistic artificially. And the threshold is the standard 0.05 — nothing clever there, it's a starting point.
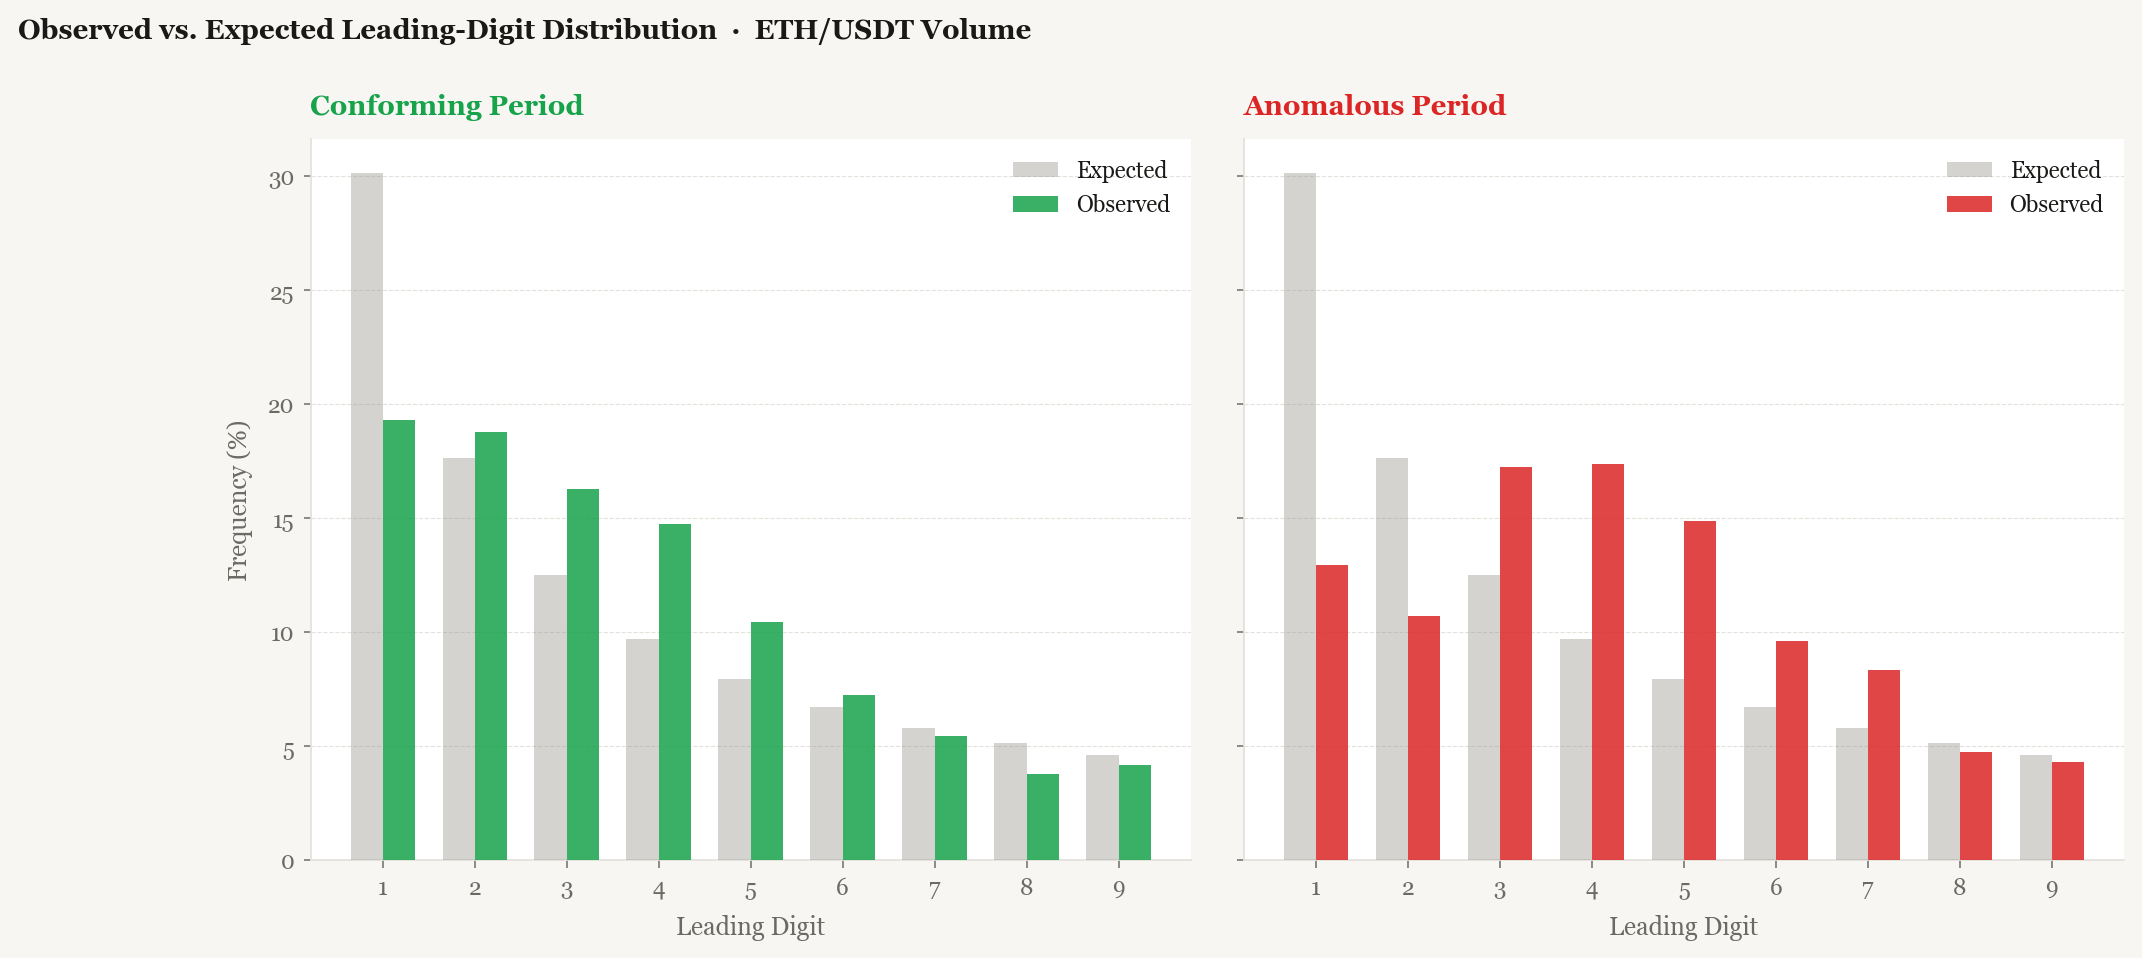
The chi-square test here has 8 degrees of freedom (9 digit categories minus 1). The critical value at α = 0.05 is 15.5. When the observed digit distribution is wildly skewed — say, an unusual cluster of large-digit moves (7%, 8%, 9% daily changes) — the statistic blows past that threshold and the flag fires.
§ 4 What the Flag Actually Means
A Benford deviation flag does not tell you direction. It does not say "sell" or "buy." It says the recent return environment has been abnormal — the mix of move sizes has diverged from what you'd expect under ordinary market behaviour. In practice, this tends to coincide with:
- Sustained trending with large daily moves (lots of 5s, 6s, 7s as leading digits)
- Volatility clusters — not a single spike, but a run of outsized bars
- Regime transitions, where the character of price action is changing
The flag is not a timing signal in the conventional sense. It is a risk signal, a warning that the current environment is no longer behaving like the one the strategy was designed for. Acting on that warning by exiting is a form of regime-conditional risk management.
§ 5 How I Use It in the Strategy
In the full strategy — which combines Heikin-Ashi candles, Supertrend, ADXR, PVO, and a smoothened Parabolic SAR — the Benford flag is wired into the exit logic on long positions only. The reasoning is asymmetric: on a long, you are exposed to sudden downward moves. If the market has recently been printing large-digit moves, the probability of a violent reversal is elevated. The flag is a prompt to step aside.
pythonif pos == 1:
    if deviation == 1:
        # Benford flag — exit regardless of other signals
        data.at[i + 1, 'Position'] = 0
    elif close_price < supertrend and ha_close <= ha_open:
        data.at[i + 1, 'Position'] = 0
    elif ha_close < ha_open and prev_ha_close < prev_ha_open \
         and atr_diff_ratio > 0.25:
        data.at[i + 1, 'Position'] = 0
    else:
        data.at[i + 1, 'Position'] = 1
The flag takes priority — it overrides all other hold conditions. This is intentional. The philosophy is that if the price action has become structurally abnormal, no other indicator is reliable enough to argue against getting out. The strategy re-enters when conditions normalise, so missing a few bars while waiting for the flag to clear is an acceptable cost.
The Benford flag is not currently wired into short exit logic. On a short position, large-digit moves in the downward direction are in your favour — the flag fires indiscriminately regardless of direction. Filtering the flag by the sign of recent moves (only exit shorts on upward large-digit clusters) is a logical extension I haven't tested yet.
§ 7 What I Am Not Sure About
There are a few things I am genuinely uncertain about here, and I'd rather flag them than pretend the implementation is clean.
The 20-bar window is arbitrary. I picked it because it felt responsive without being noisy, but I have not run a proper sensitivity analysis. A shorter window (10 bars) produces far more flags with questionable informativeness. A longer window (60 bars) almost never fires — which might be better, or might just mean it misses the signal entirely.
Benford's Law and financial returns are not a natural fit. The law's theoretical grounding assumes data spanning several orders of magnitude. Daily percentage changes are bounded — they don't range from 0.0001% to 10000%. The approximate match is empirical, not derivable. I am using the distribution as a benchmark for "normal" digit mix, not as a strict probabilistic model.
The chi-square test assumes independence. Rolling windows of daily returns are not
independent. Consecutive windows overlap by n-1 bars. The test's p-values are therefore
not strictly valid as independent hypothesis tests. They are being used as a relative measure — how
far is this window from Benford — not as a formal statistical claim.
The flag fires after the fact. On a 20-bar window, by the time the distribution has diverged enough to trigger the chi-square threshold, the market has already been abnormal for a while. The flag is late by construction. Whether it is still early enough to be useful is an empirical question that the backtest answers optimistically but reality may not.